4.0.0
Data sources
A new Data source pane in report settings allows report administrators to more easily configure which JIRA issues will be available to the report. Available data sources are:
- Select a project
- Select a board
- Select a filter
- Enter a JQL query
- All issues
Manually configuring a JQL query as the data source works the same as it used to, but this setting has been moved from the Filtering pane to the Data source pane:


Other data sources will determine which issues to include as follows:
- Select a project will include all issues belonging to the specified project
- Select a board will include all issues returned by the JQL query of the filter that the specified board is configured to use
- Select a filter will include all issues returned by the JQL query of the specified filter
- All issues will include all issues that the report viewer has permission to access


Other notes:
- The default data source when creating new reports is still All issues, though this is likely to change in a future release.
- When using a data source that relies on an external JQL query (Select a board, Select a filter), the report will always use the current query rather than the query as it existed at the time of report creation.
- All existing reports have been migrated. Reports that had specified JQL queries previously are now set to the Enter a JQL query data source and the existing query will remain intact. Reports that did not specify JQL queries previously are now set to the All issues data source.
- Due to limitations of the JIRA API, when using Select a filter as the data source, only filters that the active report administrator owns or has added to favourites will be available in the filter selection dropdown – it is unfortunately not currently possible to retrieve a list of all filters that a user has permission to access from the JIRA API. To select a filter that doesn't show up in the list, the report administrator must first locate the filter and add it to favourites.
Data loading status indicator
When running reports with a data source that returns a lot of issues, it can take quite a while to fetch all of the issue data from JIRA before the report can be displayed. Previously, a loading message and spinner icon were displayed, but it was still not always clear whether the data was really still loading or if something had silently failed. In this release, a robust status indicator has been added to supply much more detailed feedback to the end user about how the data load is progressing.
Whenever a data load is attempted, the indicator will be displayed at the top of the report. Information will always include the number of issues returned by the specified data source and the progress in terms of the number of issues that have been loaded thus far (both as a percentage and with a graphical progress bar).


When the configured data source returns a large number of issues (1,000+) that must be fetched in multiple batches, the indicator will turn yellow and display a warning to the user including the estimated time required to complete the fetch.


If an error does happen to occur during the fetch, the indicator will turn red and display an error message to the user including the details of what went wrong. In this example, an invalid JQL query was configured as the data source.


Report display preferences
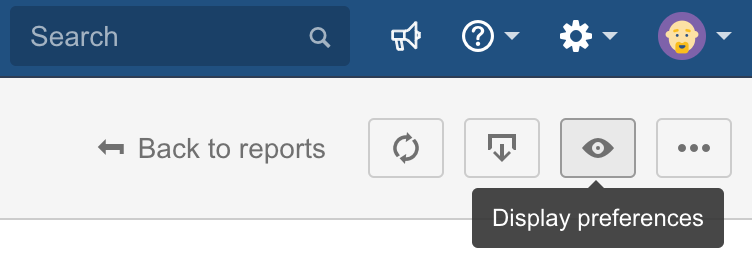
A new Display preferences button is now visible when viewing or configuring a report. This menu will contain controls related to runtime display preferences.


Initially, there are two controls available:
- Expand all grouping levels, which opens all grouping levels so you can see the individual issue data
- Collapse all grouping levels, which closes all grouping levels so you only see the summary data
These are user-specific display preferences that are not saved as part of the report configuration, and therefore will reset each time the report is viewed. As was the case previously, grouping levels will begin in an expanded state when the report is initially viewed.
Various fixes
- (Fix) Fixed a crash caused by a report data load continuing to run in the background after the user has navigated away from the report. In-progress fetches are now aborted as soon as a user selects a different data source or navigates away from the report.
- (Fix) The previous method of fetching data for Epic Links proved somewhat unreliable and has been replaced by a more reliable and efficient method.
- (Fix) Fixed a crash caused by configured grouping, sorting or aggregation rules referencing a field that no longer exists in JIRA. The invalid rules are now identified and simply skipped during processing.
Various changes
- (Change) Updated various language to match recent upstream changes to JIRA – most notably, "Report settings" is now used in favour of "Configure report".
- (Change) The Filtering pane has been updated with temporary help text until filtering rules are made available in an upcoming release.